Japanese Candlesticks is one of the most popular cryptocurrency trading candlesticks. This is an integral part of technical analysis. Candlesticks are used to recognize the behaviour of traders.
We will be looking into the body parts and sizes of candlesticks, and the various types of candlesticks with their different identities.
We will be looking into the following:
Candlestick Colours
Candlestick Body Parts
Candlestick Body Sizes
Candlestick Shadows
Engulfing bar candlesticks
Doji Candletick
Dragonfly Doji
Gravestone Doji
Hammer ( Hammer Pin Bar)
The shooting star (bearish pin bar)
The Harami Candlestick (Inside Bar)
The Morning Star Candlestick
The Evening Star Candlestick
The Tweezers Top and Bottom

Candlestick Colours:
The white or green candlestick bar represents positive uptrend or bullish market movement while the black or red candlestick represents the downtrend or the bearish market movement.
NB: The color doesn’t matter.
Candlestick Body Parts:
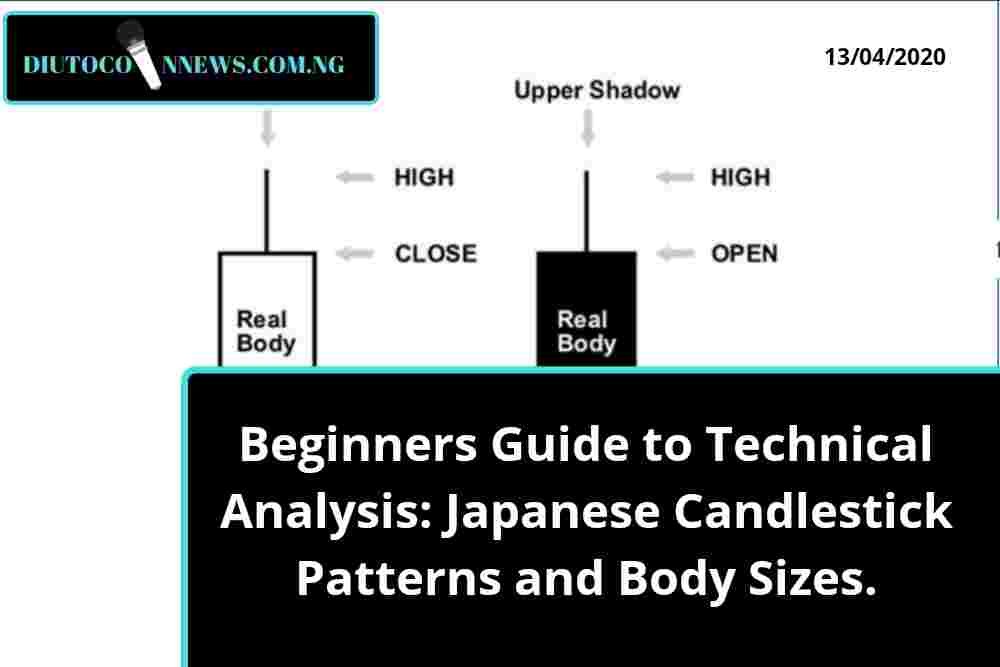
If the close is above the open we know its a bullish candlestick which shows that the market is rising at this period of time. But when the close is below the open, we know that the market bearish which shows that the market is going down at this period.
Candlestick Body Sizes:
Candlesticks with long bodies refer to strong or selling pressure. If the candlestick is long with the close above the open, it means that the buyers are strong and are pushing the market up.
Register a New Binance Account to Start Trading on Binance
If the candlestick is short with the open above the close, it means that the sellers are strong and are pushing the market down. Little or short candlesticks indicate little buying or selling pressure.
Candlestick Shadows:
Upper Shadows signify that the session is high while Lower Shadows signify low session. Candlesticks with long shadows show that the trading action occurred well past the open and close parts.
While candlesticks with Short Shadows indicate that most of the actions occurred near the open and close.
But then, candlesticks with long upper shadows and short lower shadows means that buyers pushed the market up but for one reason or another, buyers came in and pulled it down.
Same goes for candlesticks with long lower shadows and short upper shadows. The sellers pushed the market down but for one reason or the other, buyers came in and pushed it up.
Different Types of Candlesticks:
Engulfing bar candlesticks:

This candlestick is formed when a candlestick is fully engulfed by the previous candlestick standing close to it. It must be fully engulfed.
Bearish Engulfing Bar Candlesticks: It has two bodies, the first body is smaller while the other body following is bigger. This means that the previous body(second/following body) engulfed the small body.

NB: When it happens in an uptrend, it means that buyers are engulfed by the sellers which triggers a trend reversal.
Bullish Engulfing Bar Candlestick: It has two bodies. The first body is small here while the second is big. Meaning that the second body here is the engulfing body. This means that buyers are now in control of the market.
NB: When this happens in an uptrend, it indicates a continuation of the signal. When it happens in a downtrend, it indicates possible(not a must) reversal.
Doji Candletick:

Doji Candlestick tells us that the market opens and closes at thesame price which means that there is an indecision between buyers and sellers. The market is equal during the period of time.
When this happens in an uptrend or downtrend, it means that the market is likely to reverse. This usually happens during a period of resting after a big market move (higher or lower).
Dragonfly Doji Candlestick:

This is a bullish candlestick which forms when the open high or low (Opening Price/Closing Price) is at the same or about the same price nearing a turning point (usually at demand and supply balance).
The long lower tail is used to identify the dragonfky doji candlestick which means that resistance of buyers to allow the market down and their attempt to push yhe market up again.
NB: It signifies a high buying pressure.
The Gravestone Candlestick:

This is the bearish verison of the dragonfly candlestick usually formed at the open and close and at the same or about the same price.
It forms a long upper tail usually at the resistance level signaling a powerful supply and the tendency of the sellers to push the marker down.
NB: It must occur at the resistance level to be reliable.
Hammer ( Hammer Pin Bar):

This candlestick is created when the open high and close are roughly the same thing with a long lower shadow. It shows a bearish rejection from buyers and their intention to push the market higher.
The shooting star (bearish pin bar):

This is formed when the open low and close are roughly the same price, this candle is characterised by a small body and a long upper shadow.
It is the bearish version of the hammer(pin bar). When it occurs in an uptrend, it signals a a bearish reversal signal. When it forms near a resistance, it will seen as a powerful signal reversal.
NB: It is used with support and resistance alongside other technical indicators.
The Harami Candlestick (Inside Bar)

This is considered as a reversal and continuation (during an uptrend or downtrend) pattern. It includes, the mother candle and the baby candle. For the harami candlestick to be valid, the baby candle should close outside the mother candle.
This is considered a bullish signal when at the bottom of a downtrend and a bearish signal when it happens at the top of an uptrend. It tells us that the market is at the consolidation level (indecision).
The Morning Star Candlestick:

This is considered as a bullish reversal candlestick pattern which occurs at the bottom of a downtrend.
It is comprised of three candlesticks:
The first candle shows that sellers are in control
The second candle shows that sellers are still in control but now at a lower rate.
The last one is bullish candlestick which means that the buyers took over from the sellers.
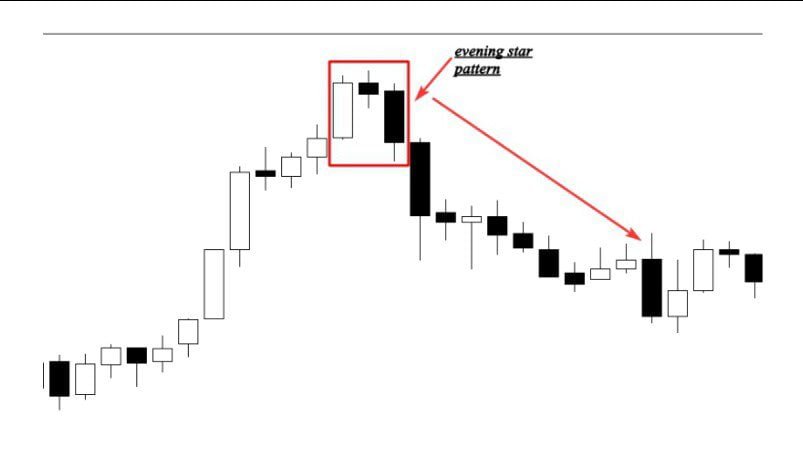
The Evening Star Candlestick:

This is considered as a bearish reversal candlestick pattern which occurs at the top of a downtrend.
It is comprised of three candlesticks:
The first candle shows that buyers are in control
The second candle shows that buyers are still in control but now at a lower rate.
The last one is bearish candlestick which means that the sellers took over from the buyers.
Tweezers Tops and Bottoms:

This consists of two huge bullish and bearish candles positioned together.
The tweezers top formation is considered as a bearish reversal pattern seen at the top of an uptrend where the bullish candle comes first, followed by the bearish candle.
The tweezers bottom formation is considered as a bullish reversal pattern seen at the bottom of an uptrend where the bearish candle comes first, followed by the bullish candle.
NB: This is a high risk investment, also note that you will need other indicators to use this candlesticks accurately.
Enjoying what you read?
Click the follow button below to join all our social media handles and get ready for our second tutorials.
Caution: Remember that cryptocurrency is a high risk investment. This is not a financial advice, please make a due research before taking any financial decision. We are not liable to any harm you will get in using any of the information in full or part.
Discover more from DiutoCoinNews
Subscribe to get the latest posts sent to your email.


